 AI
AIData analysis for business: the steps, the software and the role of AI
A practical guide to data analysis for Saudi companies: seven steps from question to decision, a worked stock example in riyals, Excel, Google Sheets, Power BI, Data Studio and Python compared by need, what built-in AI can do, and the PDPL rules for customer data.


Key takeaways
- Start every analysis from one decision and one question; most companies gain most from describing what happened and why before they forecast.
- Check data quality first: NDMO's standards use six dimensions, namely completeness, uniqueness, timeliness, validity, accuracy and consistency.
- On 14 October 2026, Power BI Desktop was a free download, Pro cost USD 14 per user a month paid yearly, and Data Studio, formerly Looker Studio, had a no-cost tier.
- Copilot in Excel, Gemini in Sheets and Copilot in Power BI speed up analysis, but check a recalculated total and a sample of rows before anyone acts on the output.
- Under the PDPL's Implementing Regulation, linking personal datasets from different sources needs a written impact assessment; anonymised data is no longer personal data.
On this page
- What data analysis answers for a business
- Data analysis steps: from a business question to a decision
- Illustrative example: a Riyadh coffee roaster's stock
- Data analysis software: which tool fits which need
- Data analysis with AI: what the built-in assistants do
- Business intelligence and data analysis: where one ends and the other begins
- Data governance and the PDPL: rules to set before you analyse customer data
- Your next step
Data analysis for business turns records a company already keeps, such as sales, stock, costs and customer files, into an answer for one decision at a time. Start with one question and one clean dataset in a spreadsheet; move to Power BI, Data Studio or Python only when the spreadsheet can no longer keep up.
This guide is written for owners and managers of Saudi companies. It covers the steps from question to decision, a worked example in riyals, the software that fits each need, what the AI built into Excel, Google Sheets and Power BI can and cannot do, and the personal data rules to set before customer records go into any of them. Prices and product details were checked on the vendors' own pages on 14 October 2026. O AI is not affiliated with Microsoft, Google or any other company named here.
What data analysis answers for a business
Most business questions fall into one of four types. Microsoft's training material for data analysts calls them descriptive (what happened), diagnostic (why it happened), predictive (what is likely to happen next) and prescriptive (what we should do), and adds cognitive analytics, which uses AI on text such as customer reviews and support tickets [1]. Saudi Arabia's National Data Management Office (NDMO) uses a similar ladder of five maturity levels: discovery, descriptive, diagnostic, predictive and prescriptive [2].
| Question type | Example in a Saudi company | Where most companies start |
|---|---|---|
| What happened? | Sales by branch and product last quarter | A spreadsheet pivot table |
| Why did it happen? | Why one branch's margin fell after a price change | The same data split by product, discount and salesperson |
| What is likely next? | Expected demand in the weeks before Ramadan | A trend line with a forecast, checked against last year |
| What should we do? | How much stock to reorder, or which price to test | Two or three options compared in riyals |
Most small and mid-sized companies get the most value from the first two rows. A forecast is only as good as the history behind it, so get "what happened" right before you predict anything.
Data analysis steps: from a business question to a decision
The US National Institute of Standards and Technology (NIST) describes the analytics life cycle as collection, preparation, analytics, visualisation and access, driven by the organisation's need to turn raw data into actionable knowledge [3]. Inside a company, that becomes seven practical steps.
- Write down the decision. Not "analyse sales", but "decide by 1 November which product lines to stop reordering". Name the person who decides.
- List the data you already have. Typical sources are the point-of-sale system, the accounting or ERP system, the online store, the CRM, and spreadsheets kept by individual staff. Note who owns each one and how often it updates.
- Check quality before you analyse. NDMO's standards measure data quality on six dimensions: completeness, uniqueness, timeliness, validity, accuracy and consistency across sources [2]. Its own example of a rule raises an alert when fewer than 90% of records have a field filled in [2]. In a spreadsheet, that means counting blank customer codes, duplicate invoice numbers and products whose codes differ between systems.
- Clean and shape the data. Remove duplicates, use one product code and one date format, and keep the raw export untouched in a separate file.
- Analyse. Start with totals, trends and comparisons by branch, product, month and customer group. Split the data further only when a number surprises you.
- Present one answer per page. One question, one chart, and one sentence that says what it means and what you recommend.
- Act, then measure. Record the decision and check the same measure four to eight weeks later. An analysis that changes nothing was a report, not a decision tool.

Common mistakes in company data analysis
- Starting from the tool ("we need a dashboard") instead of the decision.
- Mixing figures with and without VAT, or gross and net sales, in one table.
- Comparing Ramadan with an ordinary month, or months of different lengths, without saying so.
- Trusting a single export without reconciling its total to the accounting system.
- Sharing a file of customer names and phone numbers when totals by segment would answer the question.
Illustrative example: a Riyadh coffee roaster's stock
Illustrative example. A specialty coffee company in Riyadh runs three branches and an online store. Its manager asks one question: which product groups tie up the most cash? The data is twelve months of stock values and cost of goods sold from the accounting system, at cost and excluding VAT.
The quality check in step 3 found that the online store and the branches used different codes for the same beans, so the codes were merged before anything was added up.
| Product group | Stock on hand (SAR) | Average monthly cost of goods sold (SAR) | Months of cover | Above a 2-month target (SAR) |
|---|---|---|---|---|
| Espresso blends | 48,000 | 32,000 | 1.5 | 0 |
| Single-origin beans | 96,000 | 16,000 | 6.0 | 64,000 |
| Brewing equipment | 120,000 | 10,000 | 12.0 | 100,000 |
| Cups and accessories | 18,000 | 9,000 | 2.0 | 0 |
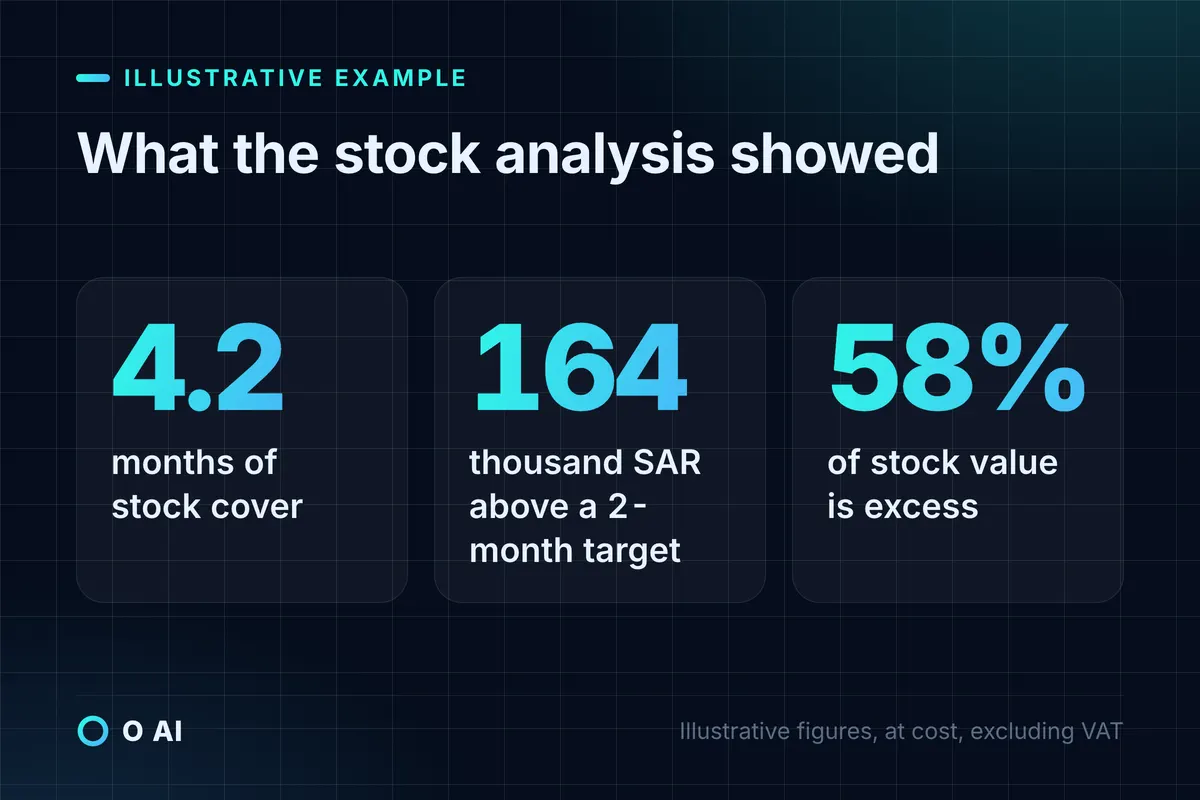
| Total | 282,000 | 67,000 | 4.2 | 164,000 |
Months of cover is stock on hand divided by the average monthly cost of goods sold. Against a two-month target, SAR 164,000, about 58% of the stock, sits above what the business needs. Espresso blends show the opposite risk: only 1.5 months of cover on the fastest-moving line.
The decision follows from the table: pause equipment reorders for a quarter, buy single-origin beans in smaller lots, and raise the reorder point for espresso blends. The next, diagnostic question is whether equipment is slow everywhere or only in the branches, and splitting equipment sales by channel answers it with the same data. All of this ran in a spreadsheet; no new software was needed.
Data analysis software: which tool fits which need
No single program is right for every company. The choice depends on how much data you have, how many people need the answer and how often it changes.
| Tool | Fits best | Limits to know | Cost (checked 14 October 2026) |
|---|---|---|---|
| Microsoft Excel | One analyst, one file, monthly questions | A worksheet holds 1,048,576 rows by 16,384 columns [4] | Part of Microsoft 365 plans |
| Google Sheets | Teams already on Google Workspace who edit together | Up to 20 million cells or 100 MB per spreadsheet [5] | Part of Google Workspace |
| Power BI | Several data sources and managers who need the same report every week | The free account creates reports for your own use; sharing needs Pro or Premium [6] | Desktop is a free download; Pro USD 14 and Premium Per User USD 24 per user a month, paid yearly, before tax [6] |
| Data Studio (formerly Looker Studio) | Dashboards over Google data, plus over 1,300 community connectors [7] | Pro adds team content management and support [7] | No charge; Pro USD 9 per user per project a month [7] |
| Python with pandas | Large or messy files, repeated cleaning, forecasting and text | Needs someone who writes code | Free and open source |
Google has renamed Looker Studio: its documentation now states that "Looker Studio is now called Data Studio" [8]. Older guides and job adverts still use both names.
Which data analysis program should a small company start with?
- One person, monthly questions, data that fits in a sheet: Excel or Google Sheets. Learn pivot tables, lookups and charts first.
- Three or more systems, a weekly management report, ten or more readers: Power BI or Data Studio, fed from the same cleaned tables.
- The same exports cleaned every week, forecasts, or thousands of free-text comments: Python. In pandas, a DataFrame works much like a worksheet, and its merge function does the job of VLOOKUP with fewer restrictions, for example returning every matching row rather than only the first [9].
Start with what your company already licenses. A Microsoft 365 company usually begins with Excel and Power BI; a Google Workspace company with Sheets and Data Studio.
Data analysis with AI: what the built-in assistants do
Data analysis with AI now happens inside the spreadsheet and the dashboard, not only in separate chat tools.
- Copilot in Excel can apply formulas across sheets, create charts and PivotTables, and show insights as summaries, trends or outliers. Microsoft notes that it might not be included in every Microsoft 365 subscription [10].
- Gemini in Google Sheets can create tables, write formulas, analyse data and build charts. Google adds that the charts it generates do not update when the source data changes, that it works best with native Sheets files, and that its suggestions can be inaccurate [11].
- Python in Excel runs Python from a cell inside an isolated container on the Microsoft Cloud, with no network access and no data kept after the session [12].
- Copilot in Power BI needs paid Fabric capacity (F2 or higher) or Power BI Premium (P1 or higher); a Pro or Premium Per User licence alone is not enough. For tenants outside the US and EU data boundaries it is off by default unless an admin allows data to be processed outside the tenant's region. Microsoft also says that prompts in languages other than English are not yet officially supported in its standalone and app-based Copilot experiences [13].
Microsoft's guidance for analysts puts the human part plainly: AI can draft summaries, suggest factors to investigate and turn questions into queries, but the analyst still confirms the method, checks that the output answers the question and decides whether the data is trustworthy enough to act on [1].
Before you rely on an AI answer:
- Recalculate one total yourself with a simple SUM.
- Check five random rows against the source system.
- Ask the assistant to show the formula or code it used, and read it.
- Keep personal data out unless the tool and its data location have been approved for it.
To choose the first task worth handing to AI, our guide on how AI can help your business shows how to measure a two-week trial before you spend.
Business intelligence and data analysis: where one ends and the other begins
Data analysis answers a question; business intelligence keeps the answer current for everyone who needs it. When the coffee roaster wants the stock-cover table refreshed every Sunday for all three branch managers, it has moved from a one-off analysis to business intelligence: scheduled refreshes, one agreed definition for each measure, and rules on who sees which branch.
NDMO's standards treat business intelligence and analytics as a domain of its own. It starts with a plan and a prioritised list of use cases, each documented with its objective, type of analytics, expected benefit, data sources, owner and intended users [2]. Copy that list even in a small company: it stops anyone building dashboards that nobody opens.
Data governance and the PDPL: rules to set before you analyse customer data
Sales and stock totals are not personal data. Customer names, phone numbers, ID numbers and purchase histories are, and Saudi Arabia's Personal Data Protection Law (PDPL) applies to them.
- Purpose. Personal data may be processed only for the purpose it was collected for, with listed exceptions, one of which covers data that will not be recorded or kept in a form that identifies the person [14].
- Minimum data. The content must be limited to the minimum needed for the purpose [14].
- Retention. Data must be destroyed once the purpose ends, unless it is kept with everything that identifies the person removed [14].
- Anonymised data. Under the Implementing Regulation, data from which direct and indirect identifiers have been removed so that the person cannot be re-identified is no longer personal data [15].
- Linking datasets. A written impact assessment is required when two or more sets of personal data from different sources are collected, compared or linked [15]. Joining a loyalty-programme list to online orders and branch sales is exactly that.
- Records. The controller keeps a written record of processing activities, including purposes and any transfers outside the Kingdom, for as long as processing continues plus five years [15].
NDMO's data management standards are written for public entities and for business partners that handle government data [2]. A private company outside that group is not bound by them, but their quality dimensions and use-case template are a sound model to borrow.
Where the analysis runs also matters. Python in Excel sends the referenced cells to a Microsoft cloud container; Microsoft states that EU customers' containers run in the EU and names no Saudi option [12]. Our guide to data residency in Saudi Arabia explains when personal data may leave the Kingdom. This section is general information; for a specific case, check SDAIA's guidance or ask a licensed advisor.
A simple working rule: analyse customers by an internal customer code and segment, not by name, and keep the table that links codes to names inside the system it came from.

Your next step
Pick one decision your company must make in the next month and write it as a question. Export the data that answers it, check it against the six quality dimensions, and build one table and one chart in the spreadsheet you already use. If the same question returns every week and several managers need the answer, that is the moment to consider Power BI or Data Studio. Data analysis for business pays off when a decision changes, not when a dashboard goes live. You can read about O AI, a software and AI company in Al Khobar, on our home page.
Frequently asked questions
What is data analysis for a business, in simple terms?
It is the habit of answering business questions with the records you already keep instead of with impressions. A manager asks a specific question, such as which products tie up cash or why a branch's margin fell, and someone collects the relevant data, checks it for gaps and duplicates, summarises it and presents one clear answer with a recommendation. Most companies start with descriptive questions about what happened, then move to why it happened, and only later to forecasts.
Which data analysis software should a small company use?
Start with the spreadsheet you already pay for, Excel or Google Sheets, and learn pivot tables, lookups and charts. Add Power BI or Data Studio when several systems feed the same report and many people need it every week; Power BI Desktop and Data Studio both have no-cost entry points. Bring in Python when files are too large or messy for a sheet, or when the same cleaning has to be repeated every week.
Can AI do data analysis on its own?
Not reliably. Copilot in Excel, Gemini in Google Sheets and Copilot in Power BI can write formulas, build charts, summarise trends and answer questions in plain language, which saves time. But they can misread a column, use the wrong definition of a measure, or produce a chart that does not update. Treat their output as a draft: recalculate one total, check a sample of rows against the source and read the formula or code before acting.
Is Excel enough, or do we need Power BI?
Excel is enough while one person analyses one file and the answer is needed occasionally. A worksheet holds just over a million rows, which covers years of sales for many small companies. Power BI becomes worth it when data comes from several systems, managers need the same refreshed report every week, and you need to control who sees which branch or region. Many companies use both: Excel for exploring, Power BI for the shared report.
What is the difference between data analysis and business intelligence?
Data analysis answers a specific question, often once: which stock is slow, or why sales fell in March. Business intelligence turns the answers that matter every week into a maintained system of shared, regularly refreshed reports and dashboards, with agreed definitions and access rules. A practical test: if the same question comes back every week and several people need the answer, it belongs in business intelligence.
Can we analyse customer data under Saudi Arabia's PDPL?
Yes, within the law's conditions. Use personal data only for the purpose it was collected for, keep only what the analysis needs, and prefer analysis by customer code and segment over names. Anonymised data, from which a person can no longer be identified, is no longer personal data under the Implementing Regulation. Linking personal datasets from different sources requires a written impact assessment. For a specific case, check SDAIA's guidance or ask a licensed advisor.
How this article was made: Researched from the sources listed below, opened on 14 October 2026. Drafted with AI assistance, then checked against those sources. General information, not professional advice. Images are AI-generated illustrations.
Sources
- Types of data analytics (training module: Discover data analysis) (opens in a new tab)Microsoft Learn · learn.microsoft.com
- Data Management and Personal Data Protection Standards, version 1.5 (opens in a new tab)National Data Management Office, SDAIA · sdaia.gov.sa
- Big Data Interoperability Framework: Volume 1, Definitions (SP 1500-1r2) (opens in a new tab)NIST · nvlpubs.nist.gov
- Excel specifications and limits (opens in a new tab)Microsoft Support · support.microsoft.com
- Files you can store in Google Drive (opens in a new tab)Google Drive Help · support.google.com
- Power BI pricing (Saudi Arabia market) (opens in a new tab)Microsoft · microsoft.com
- Data Studio: features and pricing (opens in a new tab)Google Cloud · cloud.google.com
- Data Studio (opens in a new tab)Google Cloud documentation · docs.cloud.google.com
- Comparison with spreadsheets (opens in a new tab)pandas documentation · pandas.pydata.org
- Get started with Copilot in Excel (opens in a new tab)Microsoft Support · support.microsoft.com
- Use Gemini in Google Sheets (opens in a new tab)Google Docs Editors Help · support.google.com
- Data security and Python in Excel (opens in a new tab)Microsoft Support · support.microsoft.com
- Copilot for Power BI overview (opens in a new tab)Microsoft Learn · learn.microsoft.com
- Personal Data Protection Law, with amendments (in Arabic) (opens in a new tab)Bureau of Experts at the Council of Ministers · laws.boe.gov.sa
- Implementing Regulation of the Personal Data Protection Law (opens in a new tab)SDAIA · sdaia.gov.sa
About the author